Wavelets have recently migrated from Maths to Engineering, with Information Engineers starting to explore the potential of this field in signal processing, data compression and noise reduction. What’s interesting about wavelets is that they are starting to undermine a staple mathematical technique in Engineering: the Fourier Transform. In doing this they are opening up a new way to make sense of signals, which is the bread and butter of Information Engineering.
At their most basic, wavelets are quite literally ‘mini waves’. Rather than being a wave that goes on forever, like sin() or cos(), wavelets are a short ‘burst’ of waves that quickly die away, like the picture below: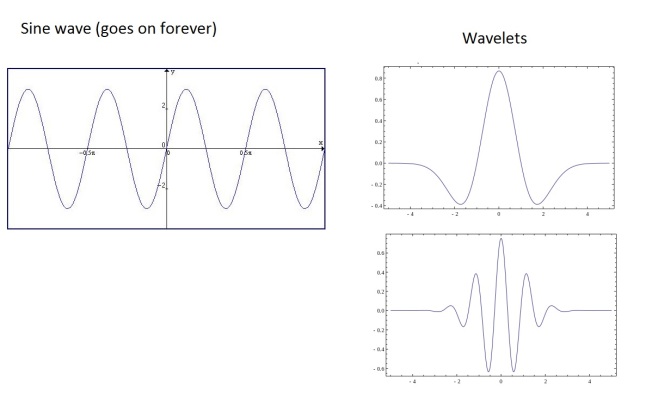
Because there are very few rules about what defines a wavelet, there are hundreds of different types. However they all take the form of a ‘mini wave’, fading to zero quickly.
These little waves are shaking things up because now Wavelet Transforms are available to Engineers as well as the Fourier Transform. What are these transforms then and why are they so important? How are Wavelet Transforms different/better than Fourier Transforms? That’s the subject of this blog post. First it describes how and why Engineers de/reconstruct a signal using the Fourier transform. It then goes on to talk about the limitations of the Fourier Transform and Heisenberg’s uncertainty principle. It ends by describing how wavelets can be used for transforms and why they are sometimes preferred because they give better resolution.
This blog post does not have much maths in it, but it does deal with concepts that might be slightly beyond someone with no mathematical background. As it is a very broad overview of the subject there are some big simplifications, but hopefully you’ll get something from it.
Time, Frequency and Fourier
In Engineering, a signal is usually something you want to send or record. For instance it could be a clip of a voice recording, like the graph below (altered from this website)

It could also be an image, a video, a word file, a graph or a multitude of other things. Basically think of a signal as a squiggly line on a graph, like above.
The picture of the voice is a signal in the time domain. This means that along the x-axis of this graph (left to right) is time, while on the y-axis (up and down) is the amplitude of the voice – how loud it is. While plotting a signal in the time domain is often a nice way to visualise it, Engineers find it useful to deal with a signal in the frequency domain. In the frequency domain, the frequency of the signal is on the x-axis, while the amplitude (or loudness) of the signal is still on the y-axis. Below, the bottom graph is a signal similar to the voice signal in the time domain. The line on the top graph is the same signal represented in the frequency domain. It’s a summary of the signal’s frequency over that time period. (altered from this website)
On the frequency graph, the three spikes would represent the low, medium and high tones of the voice. It’s important to remember that the top graph only represents frequency and not time; it is merely another way of looking at the signal.
The process of getting from the time domain to the frequency domain, and from the frequency domain back to the time domain, is called the Fourier Transform. In the 1820’s Joseph Fourier had the remarkable insight that any signal can be represented by an equation that just adds up a combination of sin() and cos(). For instance the formula for a square wave (a binary signal, 1,0,1,0,1,0) is:

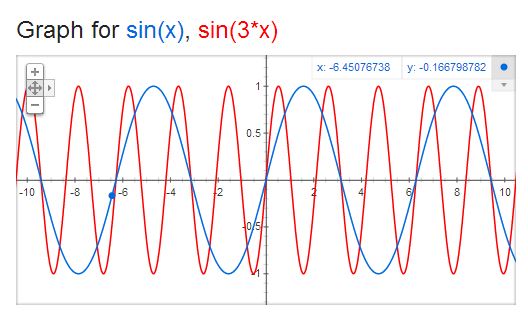
The adding of sin() waves carries on until infinity (ignore the 4h/pi bit). It is worth noting that each sin() term is a different frequency. For instance sin(x) and sin(3x) look like this in the time domain:
And in the frequency domain are spikes:
They are spikes because each sin() term is oscillating at different speeds, meaning they are different frequencies. Every sin() wave has a frequency. They’re equivalent. In the frequency domain 2 different frequencies represent 2 points on the x-axis, so they are spikes of a certain height.
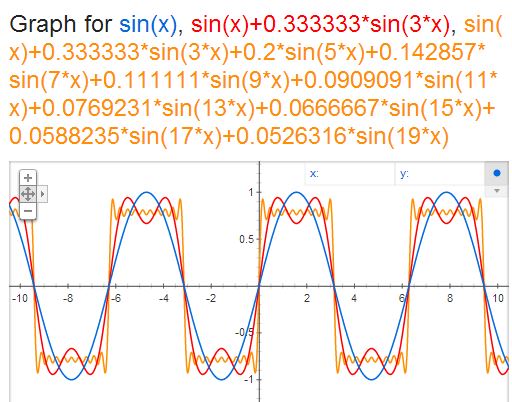
The function above shows how a very awkward shape like a square or triangle can be represented by adding a load of different frequencies together. Below is a graph of sin(x), the first frequency of the square wave, sin(x) + 1/3 sin(3x), the first two frequencies, and the first 10 frequencies:
You can see how it starts to look more like a square wave the more sin() terms, or frequencies, you add. The point is that any signal can be decomposed into an equation with just sin() and cos() waves being added together, resulting in a frequency graph.
Once you do a Fourier Transform on a signal you can reduce noise, compress data, modulate, filter, encode and more. All these processes require the signal to be manipulated in the frequency domain, so a Fourier Transform is done before any work begins. This is why it is the bread and butter of Information Engineering; it is one of the first ways you analyse and think about a signal. Once the signal has been dealt with, you can Fourier Transform the signal from the frequency domain back to the time domain. The signal will then look different to the original, but hopefully different in the way you want 🙂
Great. So we’ve seen how the frequency domain is a useful way to look at signals and that a Fourier Transform is the way to get there. Most of us have an idea of what frequency is (listening to different pitches of singing), and it a common sense way to think about signals. So is that all? Not quite. While the Fourier Transform is useful in countless ways (especially since the Fast Fourier Transform – a quick way for a computer to do it), there is a drawback. This drawback has to do with resolution and is best explained using an unexpected source: Heisenberg (not the meth dealer).
The Uncertainty Principle
It so happens that a limitation of the Fourier Transform has to do with Heisenberg’s Uncertainty Principle (which, as an Engineer, I am pretty uncertain about). In Physics the principle goes along the lines of: you can know where a particle is or how fast it is going, but not both. The process is a trade-off. If you want to become more certain about the position of the ball, you have to become less certain of the speed of the ball and vice versa.
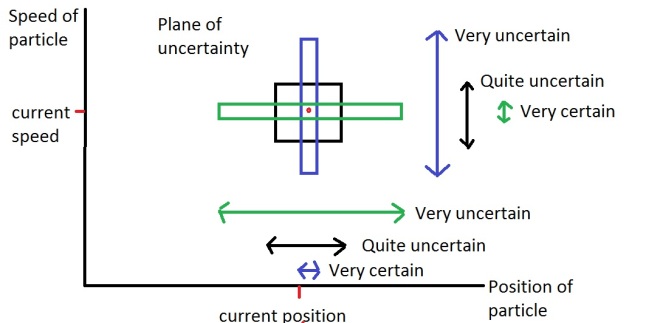
The graph below is a representation of the uncertainty principle. The position of the ball is on the x-axis and the sped of the ball is on the y-axis. The red dot shows the actual speed and position on the graph, however you can see that it is surrounded by boxes. The boxes represent the uncertainty you have about each value:
Each box has the same area. As the area represents how uncertain you are about speed/position, it follows that there is always a minimum amount of uncertainty in the measurement of both values. For instance the blue box is tall and thin. The fact that it is thin around the position of the ball indicates that this measurement is pretty certain of the position. However to keep the box the same area, it has to stretch out along the y-axis, indicating that it is unsure of the value for the speed.
This amount of uncertainty is also called resolution of the measurement.
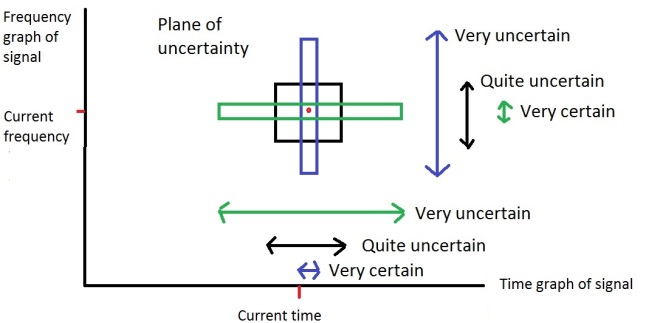
The Fourier Transform has the same problem of resolution. You can either be sure of the frequency or the time of a signal, but not both. The graph below is the same as above, but with the frequency and time domain replacing the speed and position of the ball, as it convenient to think of it in the same way:
The problem is that you when you are studying a real signal it would be useful to know what the ‘instantaneous frequency’ of the signal is. The instantaneous frequency is the exact frequency of a signal at an exact moment in time. For instance if I was listening to a music track I would like to be able to say ‘at 1 min 59.0423 seconds into the music track the sound is 1563.2 Hz’. Unfortunately the Fourier Transform cannot do this because there exists a minimum amount of uncertainty between the frequency and time domains, like Heisenberg has a minimum amount of uncertainty between the speed and position of a particle (the area of the box). You can know the moment in time you want to find the frequency for (like the blue box), but because there is a minimum uncertainty, the box of has to stretch out across frequency, meaning that you are unsure of the frequency at that moment in time.
The best you can do with a Fourier Transform is to sample a range of time (for instance, the time signal between 1 min 58 sec and 1 min 59 sec in a song) and find a range of frequencies that were played over that amount of time, as represented by the black box. An example of this can be seen by looking at the third picture in the post again. There is a signal over a range of time (e.g. someone saying ‘hello’) and the frequency graph is the range of frequencies recorded over that time.
Instantaneous frequency may seem like a pedantic problem in signal processing and often it is; as I’ve already said the Fourier Transform is great in a lot of situations. However it still persists. Engineers have tried to deal with this using altered Fourier Transforms, but they still have the same problem. For instance the picture to the left below shows the time signal of sin(x^2). This is a signal that has a frequency getting steadily faster. The middle picture is what the exact frequency of the signal is over time. The right picture is what a ‘Windowed Fourier Transform’ thinks the frequency is over time. You can see by the thick dark shaded line that it is uncertain what the frequency is at any moment in time, even though the original signal does have an exact frequency at each moment:
Now we’ve seen how the Fourier Transform suffers from the uncertainty principle, or to put it another way we’ve seen how the Fourier Transform has a lack of resolution between the frequency and time domain. This is where wavelets come in. Decomposing a signal into wavelets rather than frequencies can give much better resolution in the domain it is transformed into. However when a Wavelet Transform is used the signal is transformed into the wavelet domain, rather than the frequency domain.
The Wavelet Transform and wavelet domain
The way in which the Fourier Transform gets from time to frequency is by decomposing the time signal into a formula consisting of lots of sin() and cos() terms added together. From there a frequency graph can be constructed.
One of the first things said in this post was that a wavelet is a ‘mini wave’ while sin() and cos() are infinite (they never go to zero and stay there, they carry on forever). During the Fourier Transform the signal is therefore being deconstructed into waves that are infinitely long. You can think of this in terms of the green box in the uncertainty graph above. If you have a high resolution in the frequency domain (i.e. focusing on one frequency, like sin(3x) ) it is hard to isolate it in time, as each frequency exists across all time. Being uncertain of the time when focusing on the frequency is the flip-side of being uncertain of the frequency when focusing on time.
To overcome this resolution problem a Wavelet Transform is used to deconstruct the signal into a load of wavelets being added together. Wavelets are useful because they are limited in time and frequency. Instead of a wavelet lasting forever and having no limit in time, it dies quickly, like the example of different wavelets below shows:
These waves are limited in time, whereas sin() and cos() are not because they continue forever. When a signal is deconstructed into wavelets rather than sin() and cos() it is called a Wavelet Transform. The graph that can be analysed after the transform is in the wavelet domain, rather than the frequency domain.
This time limiting quality about wavelets is useful to Engineers as it provides more resolution in the time domain. Instead of modelling with an infinite wave, it is possible to model with a finite wave which you can ‘slide’ along to time domain. The ability to slide the signal is the what gives Engineers a more accurate representation of the signal and therefore a better resolution in time.
How do wavelets handle low and high frequencies? For high frequencies a sin() wave gets squished together and for low frequencies the wave gets stretched out. The same goes for wavelets. This is handled by something called the scale of the wavelet. The picture below shows the same wavelet at different scales:
This is the wavelet equivalent of a low, medium and high frequency.
So when you use a Wavelet Transform the signal is deconstructed using the same wavelet at different scales, rather than the same sin() wave at different frequencies. As there are hundreds of different wavelets, there are hundreds of different transforms that are possible and therefore hundreds of different domains. However each domain has ‘scale’ on the x-axis rather than ‘frequency’, and provides better resolution in the time domain by being limited.
Engineers have started compressing data, processing images and reducing noise using wavelets rather than frequencies with some success. In many situations the Fourier Transform is what is known and preferred, but in certain situations a Wavelet Transform can outperform it. For instance in images that are have ‘arbitrary’ noise, filtering the noise using wavelets rather than frequencies is often preferred. The image below has been ‘denoised’ using wavelets:

Not too bad right?
I like wavelets because they have opened up my mind on how I think about analysing signals and what a transform really is. Studying the frequency of a signal makes sense as it is an intuitive concept, however a the Fourier Transform is just one of many transforms. The others have no obligation to copy a natural concept like ‘frequency’ and can represent a signal in a variety of ways. Some of these representations are useful to Engineers and some are not. But wavelets serve to show that a signal can be viewed and represented however you want. Information can be moulded, but it’s what you make of the information that counts. Representing the data in different domains is often easy, but being able to have the insight to execute a task in one domain over another is part of the art of Information Engineering.
This blog was an introduction to Wavelet Transforms, using Fourier Transforms and Heisenberg’s Uncertainty Principle as a way to highlight what the transforms are and why they’re useful. I hope you have enjoyed it!




Awesome post! Really helped with my Advanced Transforms course
great explication! simple and clear! thank you!
Amazing,I studied Telecomunications engineer and this is the best explanation of wavelets i’ve ever read.
Thank you
Thank you so much. I have probably read a dozen explanations on wavelet transform and this is the best.
I have begun to understand wavelet theory thanks to your explanation. Thank you so much friend.
I like your post! thank you
Great lesson Thanks alot
It’s a good starter for “wavelets”!
Fantastic, the best explanation of wavelets ever. This single page is worth more than two metres of books!
Excellent!! Thanks a lot for sharing!
Thank you very much for your amazing introduction. 🙂
Very good attempt, I can send detailed comments you may want to add to it
Thank you very much for detailed explanation, please can you proceed to curvelets and other transforms….
I’ve searched both the time and frequency domain of the internets to find a proper explanation of this stuff – one that didn’t assume that I’m a math expert. This was it! Thank you so much for a good down-to-earth explanation.
good work. thanks for the post.
i would like to share that i also find this post useful:
http://users.rowan.edu/~polikar/WAVELETS/WTtutorial.html
for understanding the basics about wavelets.
Thank you!
Great explanation, thanks!
Thank you for this! I ‘ve been trying to do some EEG signal processing and this made a lot of things more clear!
Thanks for this! I ‘ve been doing some EEG signal processing and this helped a lot!
Thank you so much for this post! I’ve understood things that I have been trying to for a long time!
Yes he did a wonderful job explaining this concept! Even more intuitive Engineering perspective of a wavelet is the set points or characteristics of a vehicle suspension. Each signal change in time domain is a mass damper response in a window. Drive around a 2D signal and you get a lower dimensional spacio temporal view of the signal just by instrumenting the suspension.
The problem I have with wavelets and maybe you can comment on this more in your explanation. For 2D images the “signal” for 2 slightly different perspectives of the same scene generates wavelet coefficients that are radically different. There isn’t any local features overlap because images don’t really have boundaries like eg written text. I guess if you do a global wavelet with different size and orientation and use a classifier some machine learning similarity works. Don’t think this is the smartest solution for image recognition where the signal for the same image can vary.
Awesome!!! This helped me a lot!! Thanks 🙂
Well explained… Thanks!!
great article
Thank you so much for this post, but I have a question regarding this image
https://georgemdallas.files.wordpress.com/2014/05/wavelets6.jpg?w=646&h=317
in this image, the Fourier version of the signal, the y axis is labelled module? what does module mean?
a sin function has two properties other that frequency, you have the amplitude as well as the phase offset.
so the y axis here should be a complex number?
so what does it mean by module == 1500 in that graph?
Hi,
I have the same question. Could you explain what does module mean here, please? It’s the same as amplitude?
Thanks for the post and the blog as a whole. It’s very very very helpful.
Math/physics guy here. It’s sort of misleading (or at least controversial) to describe the uncertainty principle as a limit on how much you can know about the velocity and position simultaneously, as though those were both always sharply defined and the problem was about gathering knowledge about them simultaneously. Modern physicists think it’s sort of a poorly named principle, but there are historical reasons for it.
In the standard quantum formalism, velocity and position are always specified in terms of a distribution over a range of values and if one observable’s distribution is concentrated sharply around a single point, then the uncertainty principle requires that the distribution associated with the other is spread out. Which is to say, particles don’t strictly have definite, sharply defined positions or velocities in the classical sense, and the closer to being well defined one is (i.e. the more concentrated the distribution is around a single value), the less well defined the other is.
Which is not to say that the metaphor about the uncertainty principle doesn’t carry over to the discussion of the time/frequency domain – I worry that it carries over a little too well. In particular, it’s not clear to me what to make of the concept of a well-defined “instantaneous frequency” for arbitrary signals. If we represent a signal as a function of time F, then it’s periodic if there’s some minimum positive P such that F(x + P) = F(x) for all times x. Frequency can then be defined reciprocally in terms of the period. Sine waves are periodic and have perfectly well defined frequencies.
The Fourier transform decomposes a signal into a kind of distribution over sine waves, each of which has a perfectly well defined frequency, but it doesn’t do anything like identify a single frequency as “the frequency” of that signal (unless that signal happens to be a sine wave), much less the frequency of the signal at some instant.
There’s a sense in which one can define the “instantaneous frequency” of a function like sin(x^2) in a fairly natural way, because you can think of it as sampling from a particular periodic function with a well defined frequency at every point in its domain. But that’s a kind of quirk of that particular definition, and has little to do with the windowed Fourier analysis pictured nearby. In general, signals aren’t going to be defined such that there’s a unique periodic function associated with each point in a way that maps on to a natural notion of “instantaneous frequency”.
In the Fourier representation, the graph isn’t fuzzy because the Fourier analysis is having trouble identifying some instantaneous frequency – it’s showing you a distribution over a set of frequencies that corresponds to a window of time where a natural notion of instantaneous frequency isn’t strictly defined.
Awesome!
Excellent. Needs updating now that Yves Meyer won the Abel prize in mathematics for his work on wavelets. They say wavelets were helpful in detecting gravity waves. Can you explain that? The wavelet graph has time on x-axis but you say the x-axis is scale. Why do engineers want to know frequency at a specific time? Can you give an example of how this can improve signal processing? There is a typo “are have”.
recently we are doing some research on wavelet transform and your blog helps us to gain basic information. I would suggest you to write blog or extend this blog with proper explanation of one or two type of wavelet transform such as Ridgelets, Symlets, Shapelets, Curvelets, or Flexible Analytic. Also try to keep derivation simple and straight and also give some task with solution.
Please mail me once if you are updating your blog( Kailash.shaw@gmail.com)
Thank You
Great article…..Thank you so much for sharing
Simple and neat explanation!!!!!!!!
I unwrapped the concept of wavelets into a nonlinear classifier with many uses including preprocessor. Do you have a book, class or recommend one that reduces the impediment of the math?
Tank you for writing this. I have been reading many articles about the Fourier Transform and Wavelet Transforms and none of them pulled the concepts together as clearly and successfully as you have here.
Very clear explanation in simple language, thank you very much for this post.
Fantastic….. For a beginner like me this is what I was looking for from a couple of days.. Thanks a lot
Amazing explanation thank you very much
Really good, thanks a lot!
This is a great article does a great job of compelling the audience to add wavelets to their toolbox. I recently made the transition from mathematician to data scientist, and found myself diving into signal analysis. It was fun because I got to see how some of the theorems from real & harmonic analysis impact signal analysis. Your pictures of the Heisenberg uncertainty principle are great, but something that I might add to the discussion is the idea that wavelets families allow you to trade frequency resolution for time resolution. I would say that Forier transforms are best used when frequency information is vital. Wavelets are best used when the user is familiar enough with the analysis and they need to trade frequency for time resolution. One final thought: wavelets are also good a resolving where signal transitions occur.
many thanks
to the writer, the way u explained is really so sweet
Great post thank you very much
Anyone here interested in Wavelets?
Please, check out my Master dissertation about PCBs inspection using Fast Wavelet Transform:
Click to access Bonello_DanielKatz_M.pdf
Thank you 😉
Thanks for an excellent introduction. It would be nice to include a sample output of a wavelet analysis (cf. power-frequency plot from FFT) with interpretations.
George, I really appreciate this blog post – I will forward it to my team.
I want to thank you for the clear explanation on such an intriguing problem. Job well done!